The State of Business Meetings
Teams from around the world shared how they feel about the meetings that drive their success.
The State of Meetings report is a publication of Lucid Meetings' Diagnostic Survey data collected in late 2019 and early 2020. We asked hundreds of leaders and employees from organizations large and small to tell us about their experience with meetings in the workplace.
The Diagnostic Survey includes general perception questions (asking how people feel and what they believe about their organization and their meetings), as well as questions designed to identify an organization's specific practices relative to the those listed in the Meeting Performance Maturity Model (i.e., do you or don't you follow each practice).
This report includes highlights from the aggregate perception data only.
In addition to the aggregate data, we collected detailed data sets from twelve organizational cohorts. These cohorts report significant differences in meeting practice and perceptions of meeting performance. To learn more about these differences, see below.
Now let's dive into the data and see what we learned!
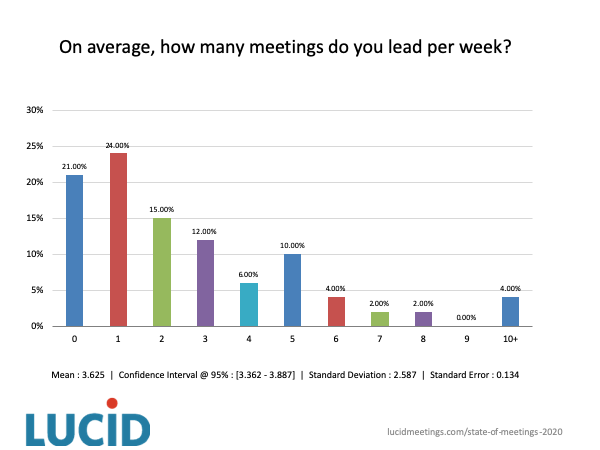
We attend far more meetings than we lead.
Forty-five percent of survey respondents lead one or fewer meetings per week. The average number of meetings conducted by all survey takers, including leaders and managers, is between three and four.
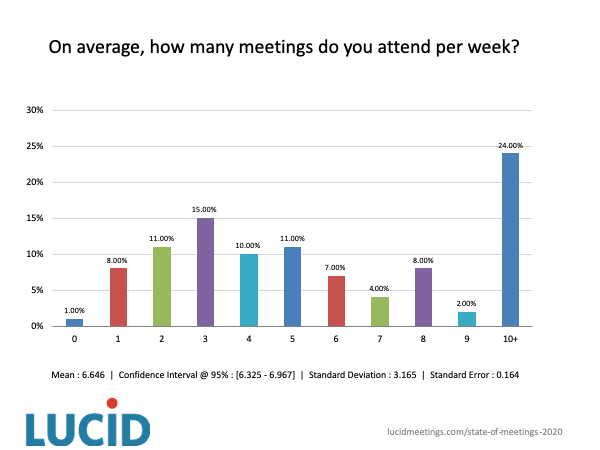
In contrast to leading meetings, the most common response to "How many meetings do you attend per week?" is "10+ per week" (24 percent), with the average number of meetings attended by survey respondents falling between six and seven per week.
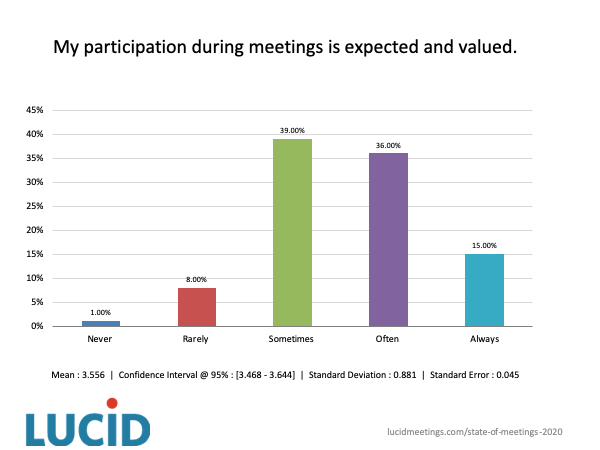
We feel valued in our meetings.
It's all too common for people to complain about their workplace meetings, but do these complaints truly represent how they feel?
Ninety percent of respondents paint a somewhat brighter picture. Fifty-one percent feel that their participation during meetings is expected and valued, either often or always. Another 39 percent feel this way sometimes.
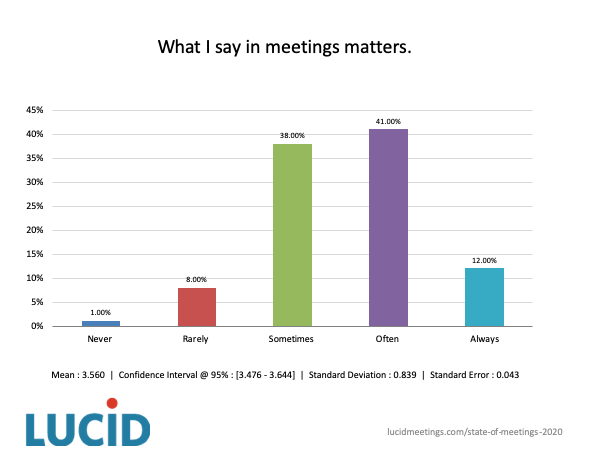
In addition, 53 percent of respondents report that what they say in meetings matters often or always. An additional 38 percent of respondents report that what they say matters sometimes.
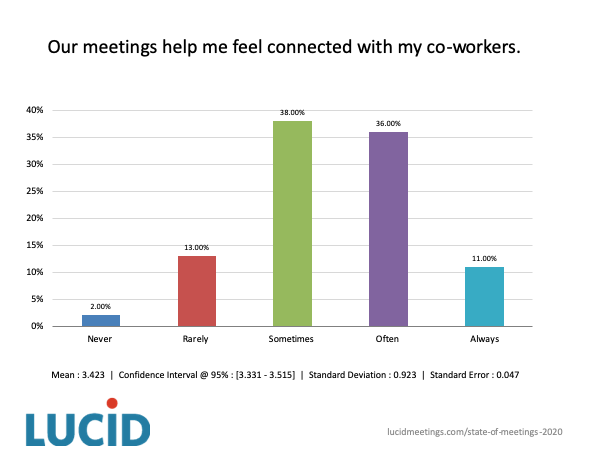
Nearly half (47 percent) of respondents report that workplace meetings often or always help them feel more connected with their co-workers.
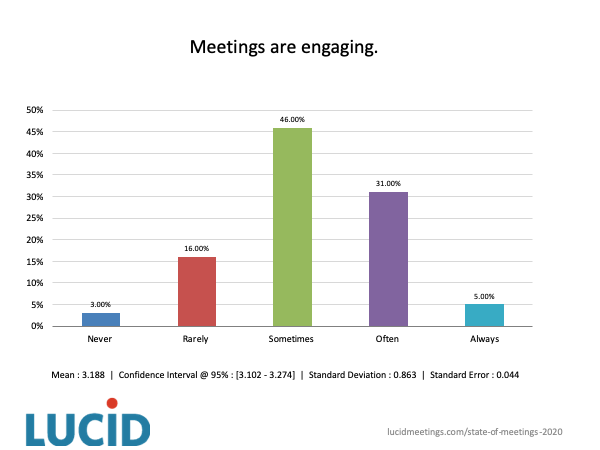
Meetings are actually pretty engaging.
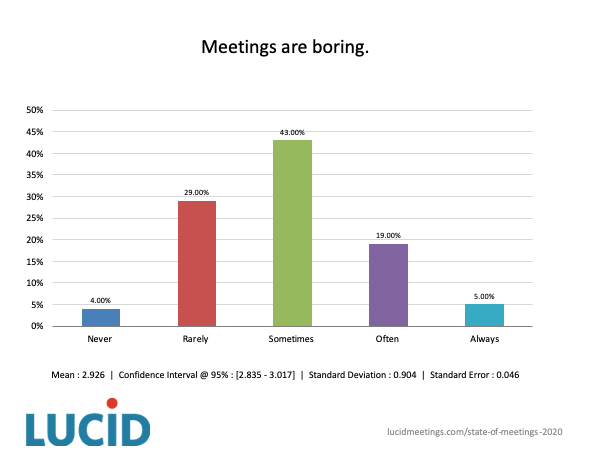
Eighty-two percent of respondents report that meetings are engaging sometimes, often, or always. At the same time, a full 33 percent report that meetings are never or rarely boring.
In all fairness, however, it's not all rosy — nearly a quarter of respondents do report boredom during meetings.
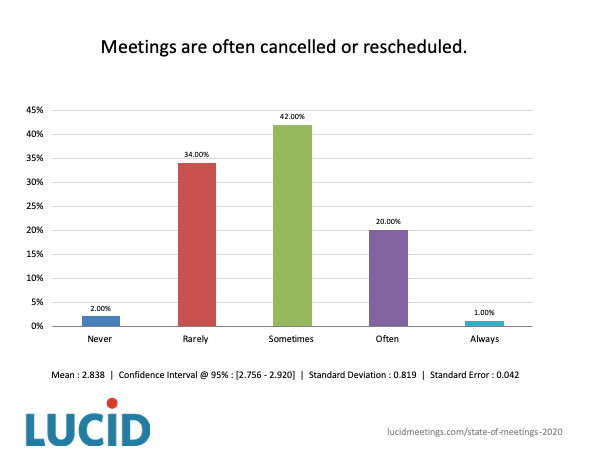
Canceling unnecessary meetings can be a good thing, but a culture of meeting cancellation signals organizational distress. In this survey, 20 percent of respondents report that meetings are often canceled or rescheduled.
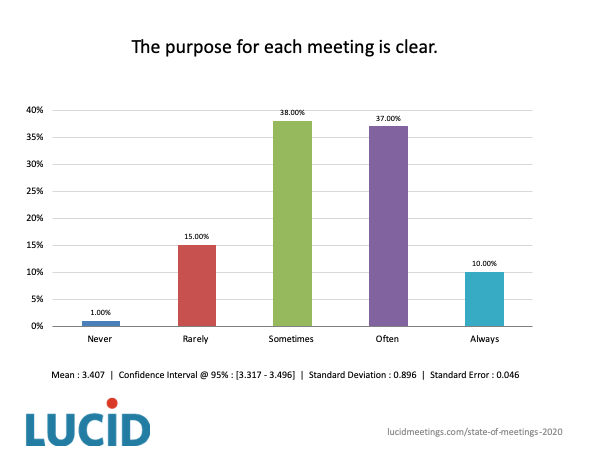
We do OK with the meeting basics (but could do better).
Understanding the purpose of a meeting — especially, "what's in it for me" — is an important component of meeting satisfaction. Forty-seven percent of survey respondents report that they have clarity of the meeting purpose often or always.
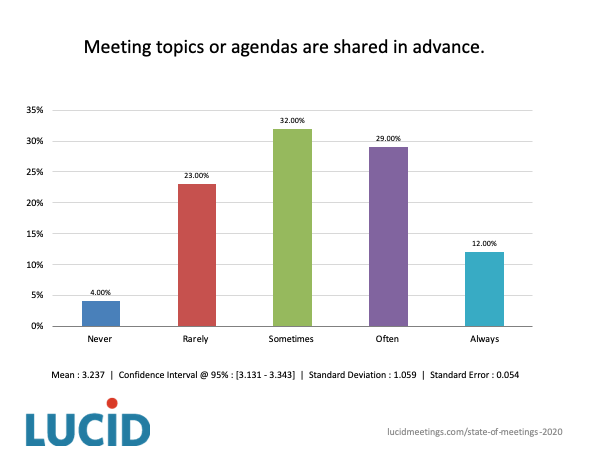
We're doing a pretty good job sharing agendas or expectations before meetings. Survey takers report that agendas are shared in advance significantly more often (47 percent) than not (27 percent).
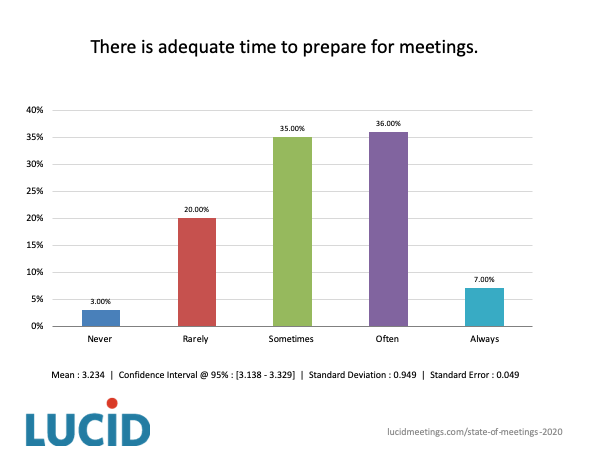
Forty-one percent of respondents say they have enough time to prepare in advance for the meetings they attend. Conversely, 23 percent feel they never or rarely have enough time to prepare.
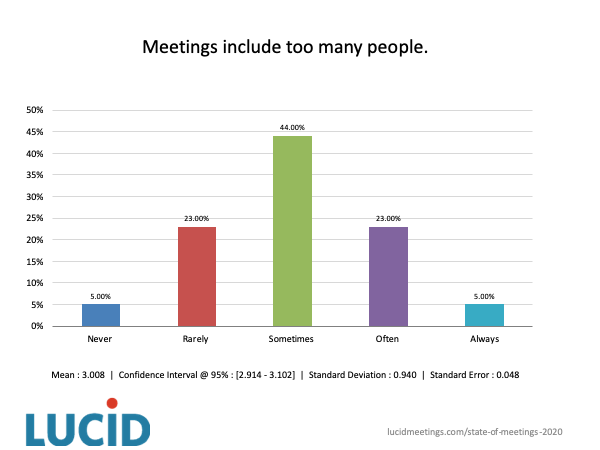
Despite public complaining, we don't really feel that meetings include too many people. In fact we're evenly split (28 percent each) between those who believe we have too many people in meetings and those who don't.
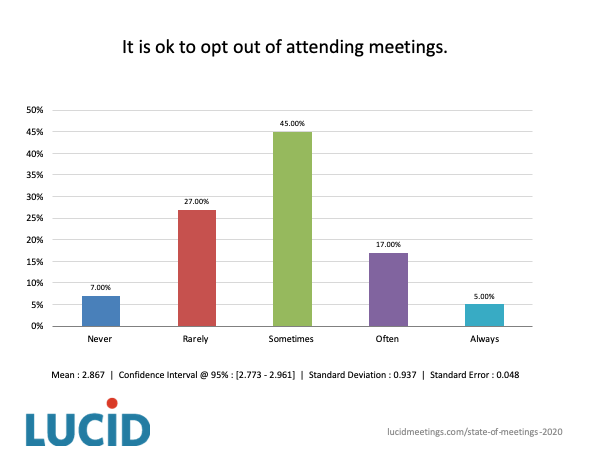
And speaking of too many people in meetings, organizations that allow people to opt-out of meetings (for valid reasons) tend to have higher employee satisfaction. Unfortunately for 34 percent of survey respondents, the ability to opt-out is rarely or never available.
Meetings produce useful results, but we don't always follow up.
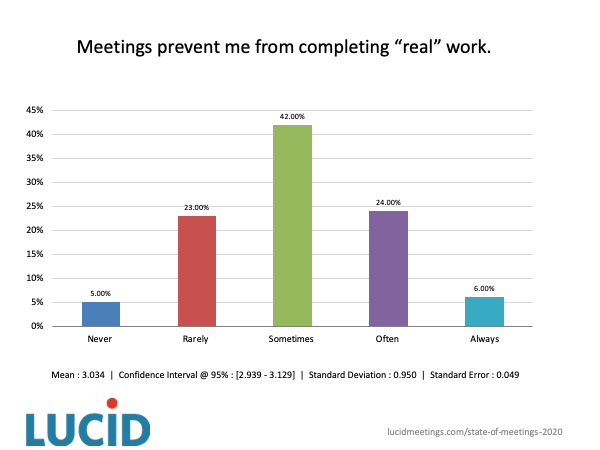
Survey respondents are evenly split as to whether meetings do useful work (28 percent) or whether they interfere in the completion of useful, "real" work (28 percent). This finding runs counter to popular complaints but mirrors earlier research that compares public vs. private perceptions of meeting value.
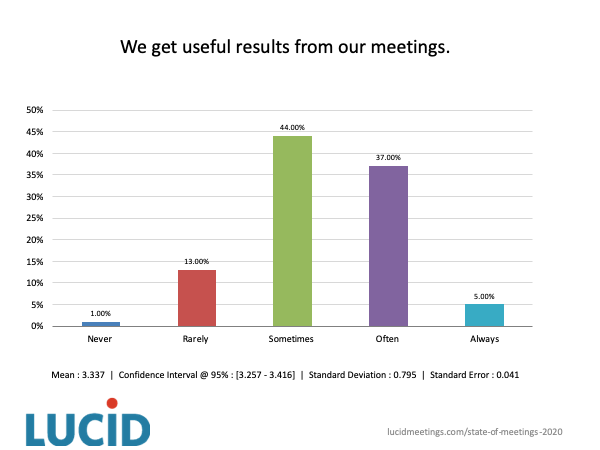
Forty-two percent of survey respondents believe their meetings often or always produce useful results; fourteen percent of respondents believe results never or rarely materialize.
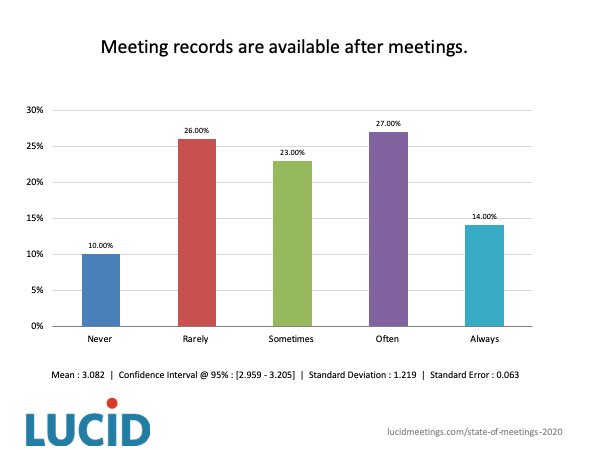
Survey respondents are fairly evenly split about the availability of meeting records, with Rarely (26 percent) matched equally with Often (27 percent). This is a mixed bag that highlights an area for further improvement.
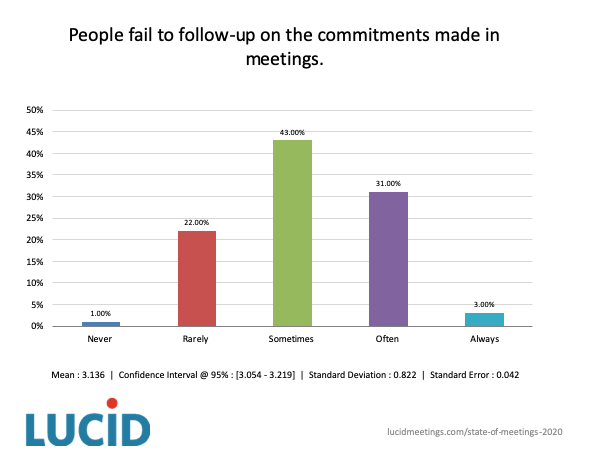
Meetings may produce results, but without a consistent, shared view of those results it can be hard to follow up on any commitments made. Respondents report that people often (31 percent) fail to follow up on commitments they've made.
Our biggest complaints are about time.
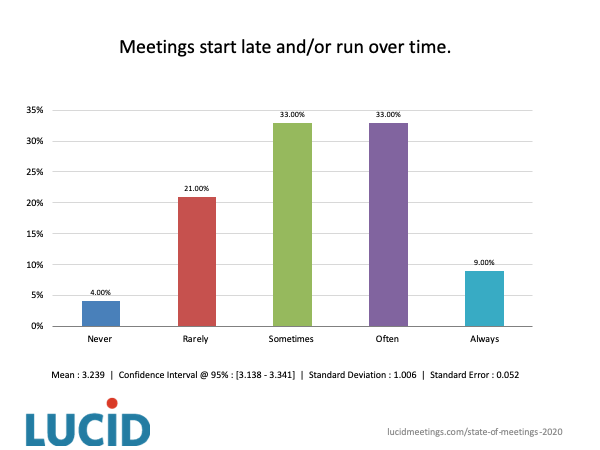
If you want to make people happy, start and end your meetings on time. Unfortunately, only 25 percent of respondents report this to be the case.
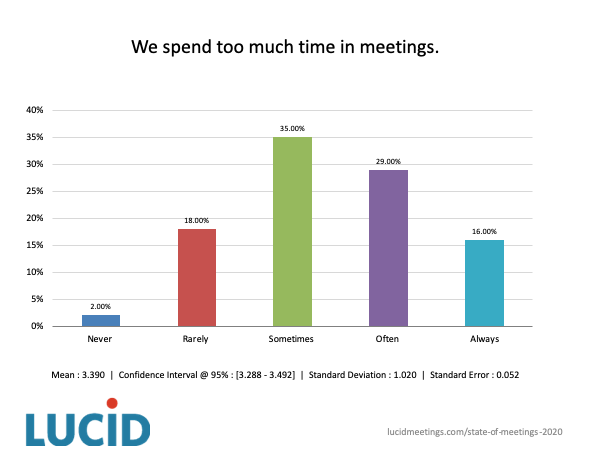
Forty-five percent of respondents say they regularly spending too much time in meetings (often or always). Only 20 percent feel this is rarely or never the case.
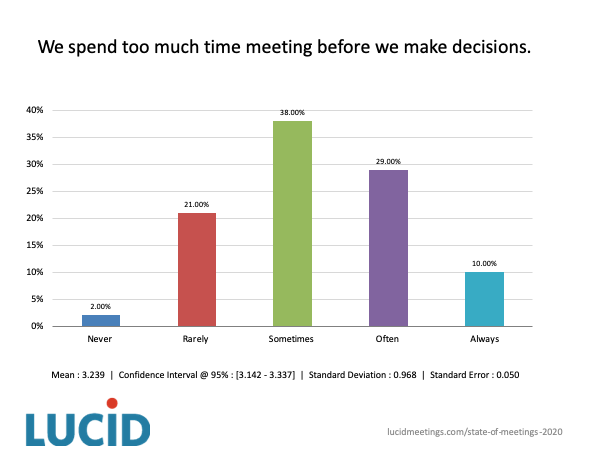
Compared with the general feelings about time spent in meetings, survey respondents are a little more forgiving when it comes to time spent making decisions in meetings.
Thirty-nine percent of respondents feel they often or always spend too much time making decisions, while 23 percent feel otherwise.
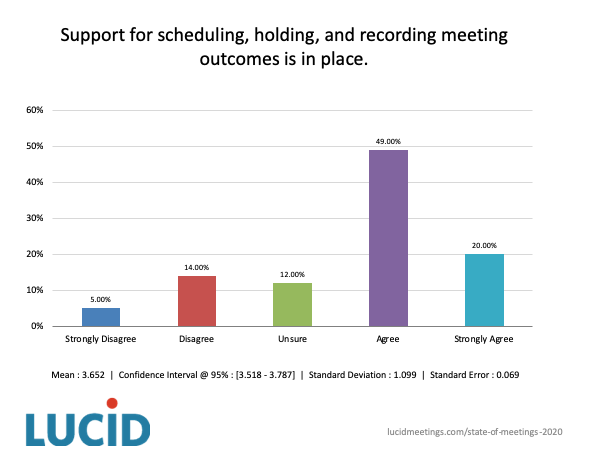
Meeting technology is available and usable.
Sixty-nine percent of survey respondents agree that support for scheduling, holding, and recording meeting outcomes is in place in their organizations.
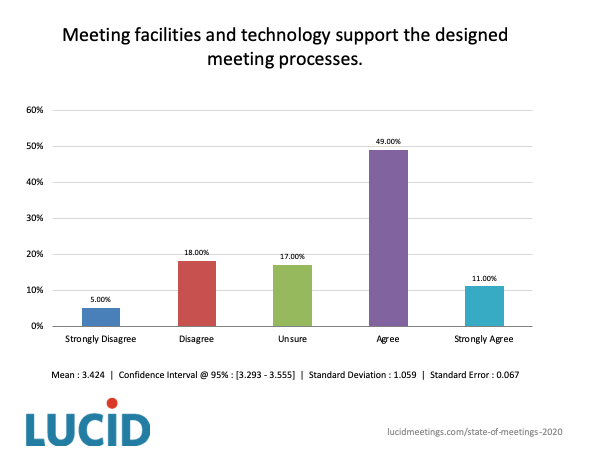
Sixty percent of survey respondents agree that meeting facilities and technology support their designed meeting processes.
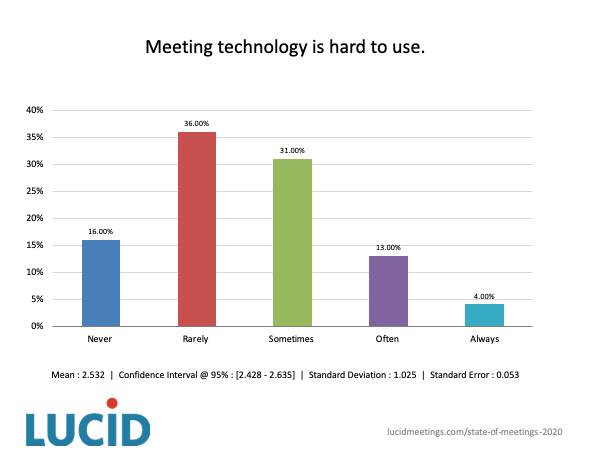
For the meeting technology in use, more than half (52 percent) report that the technology is rarely or never hard to use.
About the data: Who took part in this survey?
In total, 427 people responded to this survey.
Location by country
Fifty-nine percent of respondents selected that they currently live in the United States, followed by Canada (9 percent), Australia (8 percent), United Kingdom (4 percent), Portugal (3 percent), Hungary (3 percent), Germany (2 percent), New Zealand 1 percent), and Netherlands (1 percent), The remaining 10 percent of countries had 1 percent or fewer respondents select them as options.
Industry Breakdown
Sixty percent of those who took the survey work in for-profit organizations. Other industries include: Government (14 percent), Education (12 percent), Non-Profit (6 percent), Health Care (4 percent), and Other (4 percent).
Organization Breakdown
Fifty-two percent of survey respondents work for small organizations (1 - 99 employees), followed by twenty-six percent from medium-sized organizations (100 - 999 employees) and twenty-two percent from large-sized organizations (1,000 or more employees).
When asked to select characteristics that describe the organization's overall work environment, survey takers responded with Challenging (14 percent), Frustrating (9 percent), Casual (9 percent), and Stimulating (8 percent).
With respect to achieving organizational performance goals, forty-four percent of survey respondents believe their organization is Moderate Performing (44 percent), followed by High Performing (39 percent) and Low Performing (11 percent).
Work Experience
The respondents to this survey have worked in their organizations for varying amounts of time. Twenty-nine percent of survey respondents have worked in their organization for "2-5 years," followed by "Under 2 years" (25 percent), "6-10 years" (18 percent), "11-20 years" (20 percent), and "More than 20 years" (7 percent).
When asked, "On average, how many meetings do you lead per week?" 60 percent of survey takers responded in the 0 - 2 meetings per week range. When asked "On average, how many meetings do you attend per week?" 24 percent of respondents report attending "ten or more" meetings per week.
How Meeting Practice Correlates with Perceived Performance
As mentioned above, this report includes highlights from the aggregate data only. In total, the complete survey includes 87 questions.
Comparing the questions about specific practices to the perception questions, especially when we filter the data by major demographic categories or organizational cohort, reveals many useful insights. We intend to share some of these insights in future articles.